12 Key Levers of SaaS Success
12 Key Levers of SaaS Success David Skok ForEntrepreneurs Blog General Partner, Matrix Partners
Goals 1 Present a simple model to understand a SaaS business 2 Show what levers a CEO can pull to get the most impact
A QUICK PREAMBLE
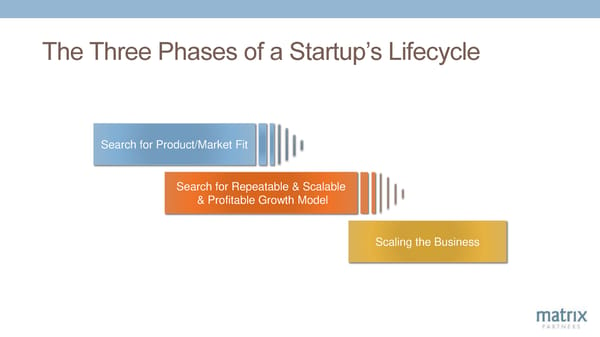
The Three Phases of a Startup’s Lifecycle Search for Product/Market Fit Search for Repeatable & Scalable & Profitable Growth Model Scaling the Business
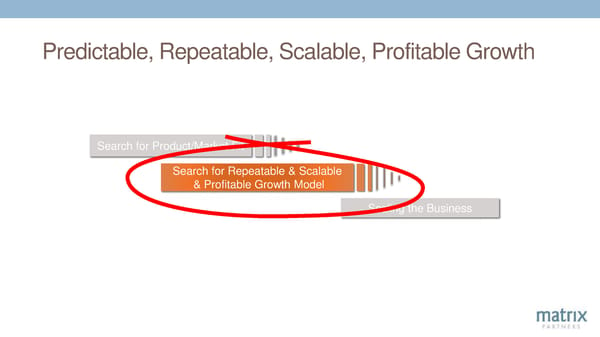
Predictable, Repeatable, Scalable, Profitable Growth Search for Product/Market Fit Search for Repeatable & Scalable & Profitable Growth Model Scaling the Business
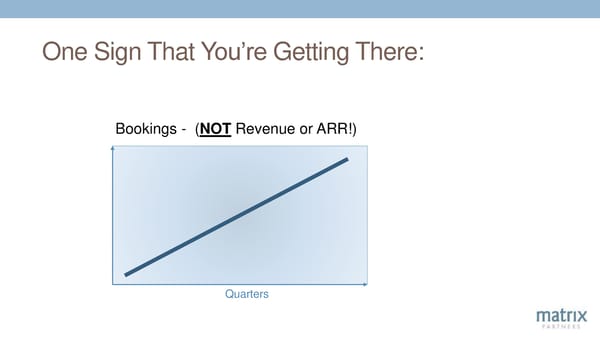
One Sign That You’re Getting There: Bookings - (NOT Revenue or ARR!) Quarters
Simple Model for a SaaS Business
A Funnel
The Full SaaS Funnel Onboard Retain Expand Loyal Customers who are advocates
The Beautiful Thing about Funnels…
Governed by very simple Math
Two Key Levers Top of Funnel Flow (Quantity) Conversion Rate
Bookings Top of Funnel Lead Flow Conversion Rate Average Deal Size
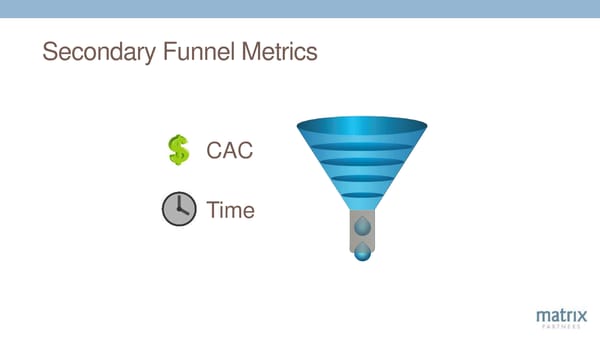
Secondary Funnel Metrics CAC Time
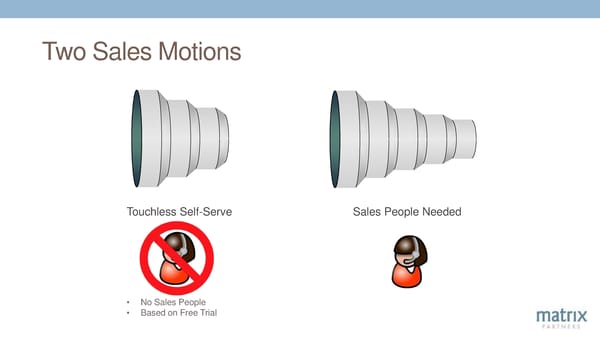
Two Sales Motions Touchless Self-Serve Sales People Needed • No Sales People • Based on Free Trial
The Simple Case: Touchless Self Serve Visitors to Sign up for Closed Web Site Free Trial Deals
Funnel Metrics are Essential "IF YOU CAN NOT MEASURE IT, YOU CAN NOT IMPROVE IT." - LORD KELVIN
The Key Metrics CAMPAIGNS TO DRIVE TRAFFIC VISITORS OVERALL CONVERSION CONVERSION % % TRIALS CONVERSION % CLOSED DEALS
Not All Lead Sources are Equal Google Ad Words FaceBookAds Visitors Visitors 5% 2% Trial Trial 10% 20% $5,000 $8,000 Customer Customer
ROI by Lead Source Cost per lead OVERALL CONVERSION % (BY LEAD SOURCE) LTV
Fix Conversion Rates First • Fix before spending heavily on Traffic growth • Three starting points: • Improve Product/Market Fit • Find the Optimal Customer Segments • Clear, Simple, Powerful, Messaging & Positioning
Funnel Conversion Rate Problems Suspects Suspects Suspects Suspects Suspects Suspects Suspects Suspects Suspects Suspects Suspects Suspects
The Source of Most Problems Suspects Suspects Suspects Suspects Suspects Suspects Suspects Suspects Suspects Suspects Suspects Suspects Vendor-centric funnel design
YOU ARE HOPING YOUR CUSTOMERS WILL DO SOMETHING THAT THEY ARE NOT MOTIVATED TO DO
IN OTHER WORDS… YOU DESIGNED YOUR FUNNEL THE WAY YOU HOPED IT WOULD WORK… BUT YOU MAY NOT HAVE THOUGHT ENOUGH ABOUT THE CUSTOMER’S POINT OF VIEW
JBOSS EXAMPLE EMAIL ADDRESS BEFORE FREE DOWNLOAD
IMPACT CUT THE DOWNLOAD RATE BY MORE THAN 10X
Get Inside Your Customer’s Head FRICTION CONCERNS
Redesign, or Try to Use What Motivates Them FRICTION CONCERNS MOTIVATIONS
JBOSS EXAMPLE • Making $27,000 a month selling documentation • Solution: • Give away documentation to get their email address
EXAMPLE: DRIVING TRAFFIC TO YOUR WEB SITE GETTING FOUND Not going to find your site unless: friction & - Top of Google search concerns - Referred to by an influencer
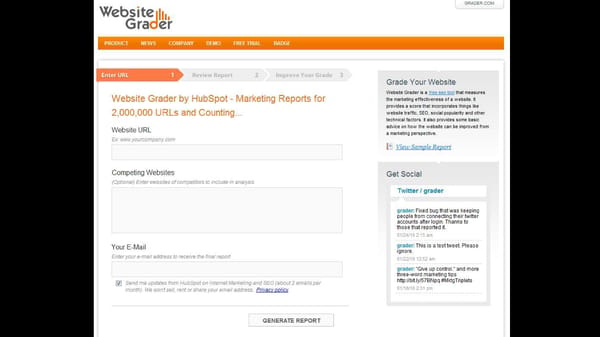
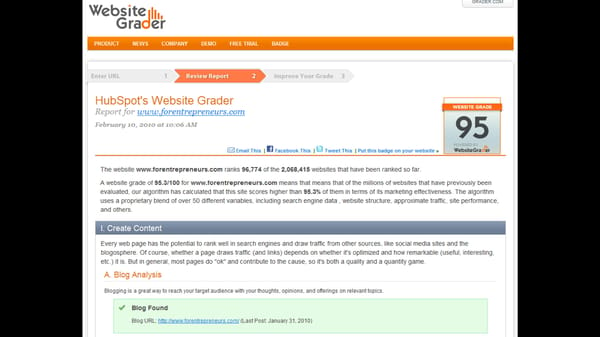
LESSONS FROM WEBSITE GRADER • Free tools drive viral spread • Low customer work required • High value delivered • Score leverages competitive urge, and acts as a trigger • Builds trust through clear demonstration of expertise
LESSONS FROM WEBSITE GRADER Shows how the product team can impact the funnel
MICROFUNNELS
Take key steps in your funnel… Free Trial
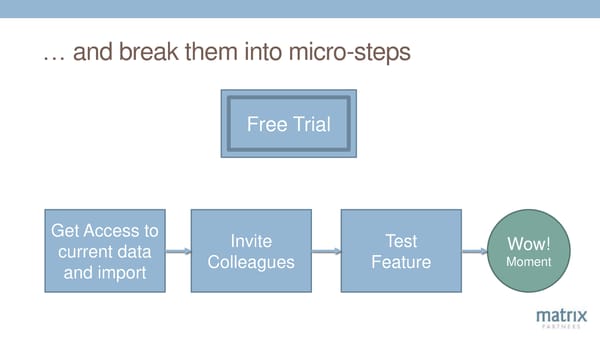
…and break them into micro-steps Free Trial Get Access to Invite Test Wow! current data Colleagues Feature Moment and import
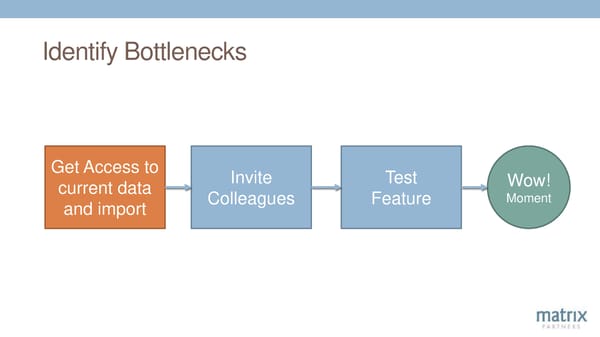
Identify Bottlenecks Get Access to Invite Test Wow! current data Colleagues Feature Moment and import
Fix Using the Same Analysis FRICTION CONCERNS
Redesign Get Access to Select Invite Test Wow! current data Moment Sample Data Colleagues Feature and import
Ideally we’re doing… Funnel Design Business Decision Buying Goals Criteria Process Customer
So far we’ve looked at the simple case Touchless Self-Serve • No Sales people • Based on Free Trial
What happens when the sale is more complex and needs a sales person? Sales People Needed
Without Sales People Visitors to Conversion Closed Web Site Rate Deals Simple linear relationship
But when you add in Sales People… Ramp Sales Time Capacity Limit
Growth Comes in Discontinuous Units
The Unit of Growth Sales Person
Supported by Leads & Customer Success Leads Customer Success, Renewals, etc. $’s Marketing Spend Sales Person SDR’s
What Drives Bookings? x No. of PPR Sales People Productivity per Rep (Average)
Let’s look at each of these in turn…
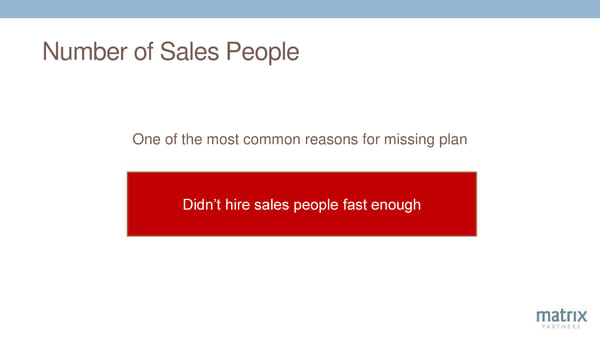
Number of Sales People One of the most common reasons for missing plan Didn’t hire sales people fast enough
Sales Hiring • You will need to build an in-house recruiting machine See my blog post: “Recruiting: The 3rd Crucial Startup Skill”
Two Metrics to Track Assigned Quota vs Plan & New ARR $2,500 Number of Reps versus Plan Assigned Quota Plan Bookings 18 $2,000 16 14 $k $1,500 12 10 $1,000 8 Reps Plan 6 $500 4 2 0 $0 Q4-16 Q1-17 Q2-17 Q3-17 Q4-17 Q4-16 Q1-17 Q2-17 Q3-17 Q4-17
Assigned Quota vs Plan & New ARR $2,500 Assigned Quota Plan Bookings $2,000 Lost Bookings $k $1,500 $500k due to slow $1,000 hiring $500 $0 Q4-16 Q1-17 Q2-17 Q3-17 Q4-17
Assigned Quota vs Plan & New ARR $2,500 Over Assigned Quota Plan Bookings Assignment $2,000 of Quota $k $1,500 needed to $1,000 85% hit plan $500 =1/85% $0 Q4-16 Q1-17 Q2-17 Q3-17 Q4-17
PPR: Productivity per Rep • Quality of sales hires • Sales Training and Onboarding
PPR: Sales Training and Onboarding • Sales People: One of the most expensive resources • Yet, typically little effort is put in to sales training in early days • High payback • Worth having the founders spend time to develop & deliver a lot of the material
Monitoring PPR 3 Charts
PPR over time Average Productivity Per Rep $170 r arte$160 qu $150 $k / - $140 ked boo$130 ARR $120 New$110 $100 Q1 Q2 Q3 Q4
PPR Looked at by Rep Tenure Average Productivity Per Rep - Grouped by Rep Tenure 180 r arte160 qu $k / 140 - ked 120 boo100 ARR 6 - 12 months 12-24 months >24 months 80 New 60 Q1 Q2 Q3 Q4
PPR by Individual Rep Rep Q2-15 Q3-15 Q4-15 Q1-16 Q2-16 Q3-16 Q4-16 John 120 165 180 145 80 110 195 Mary 80 110 135 155 150 145 Fred 60 35 75 40 55 Alice 85 145 160 180 145 Joe 60 110 85 130 145 Mike 155 170 145 190 Sarah 35 45 70 45 Sue 80 145 175 165
% of Reps at Quota % of Reps above % of Reps above 75% of Quota 100% of Quota 100% 100% 90% 90% 80% 80% 70% 70% 60% 60% 50% 50% 40% 40% 30% 30% Q1-16 Q2-16 Q3-16 Q4-16 Q1-16 Q2-16 Q3-16 Q4-16
There’s one other thing that drives PPR Adequate Lead Flow
THE MAGIC OF FUNNEL MATH
Funnel Math Raw Lead 20% Marketing Qualified Lead 80% Sales Accepted Lead 25% Opportunity 20% Closed Deal
Reverse Funnel Math Raw Lead 125 Raw Lead 20% Marketing 25 Marketing Qualified Lead Qualified Lead 80% Sales Accepted 20 Sales Accepted Lead Lead 25% Opportunity 5 Opportunity 20% Closed Deal 1 Closed Deal
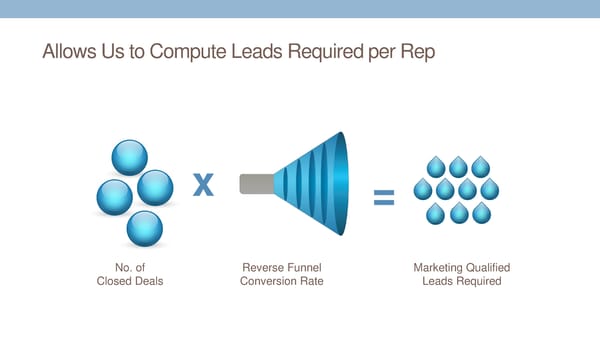
Allows Us to Compute Leads Required per Rep x = No. of Reverse Funnel Marketing Qualified Closed Deals Conversion Rate Leads Required
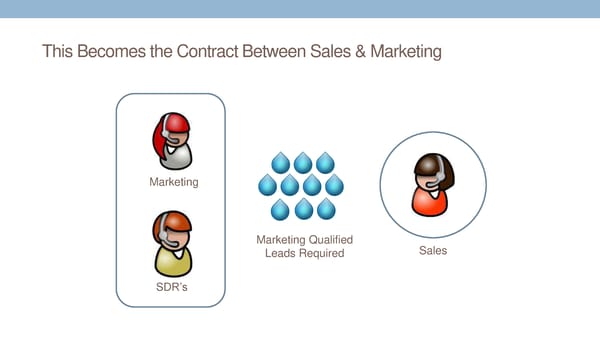
This Becomes the Contract Between Sales & Marketing Marketing Marketing Qualified Sales Leads Required SDR’s
The Backend of the Funnel It’s all about LTV Loyal Closed Deals Onboard Renew Expand Customers who are Advocates
Top Factors Affecting Renewals • On-boarded successfully? • Champion still at the company? • Customer getting meaningful business benefits? • Is the product Sticky?
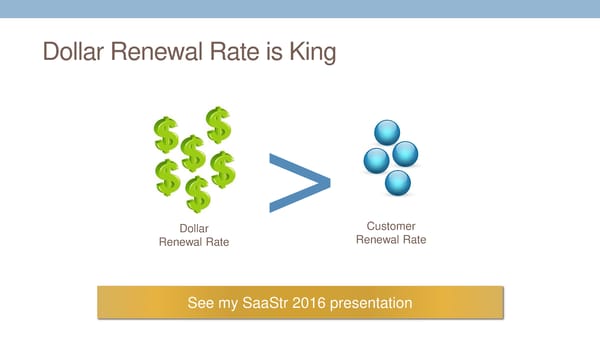
Dollar Renewal Rate is King > Dollar Customer Renewal Rate Renewal Rate See my SaaStr 2016 presentation
SUMMARY 12 Key Levers for SaaS Success
Simple Team Focus: Optimize your Funnel
Funnel Optimization Meetings • Start by diagramming your funnel • Draw the micro steps for key parts e.g. free trial
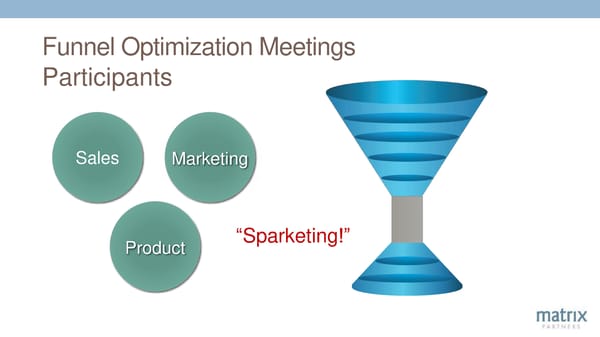
Funnel Optimization Meetings Participants Sales Marketing Product “Sparketing!”
Key Levers 1. Product/Market Fit
Key Levers 2. Top of Funnel Lead Flow 3. Conversion 4. CAC Rate
Key Levers 7. Enough 5. No. of 6. PPR Leads Sales People Productivity per Rep (Average) (Recruiting)
Key Levers LTV 8. Pricing 9. Customer Retention Rate 10. Dollar Retention Rate (Ability to “Land & Expand”)
Key Levers Cash to Finance the Business 11. Months to Recover CAC
Key Levers Building a Great Organization 12. Recruiting, Onboarding & Management
For more details on all these topics: forentrepreneurs.com Presentation Slides: forentrepreneurs.com/saastr-2017

9.png)
