State of the Cloud 2019 from Bessemer Venture Partners
INTERACTIVE KEYNOTE | SaaStr Annual 2019 | Speakers: Byron Deeter and Kristina Shen
State Of The Cloud 2019 BYRON DEETER KRISTINA SHEN Partner Partner BVP BVP @bdeeter @kshenster
State Of The Cloud 2019 Byron Deeter Kristina Shen Partner Partner BVP BVP @bdeeter @kshenster www.bvp.com/cloud
BESSEMER’S TOP 10 LAWS OF CLOUD COMPUTING 2008
0

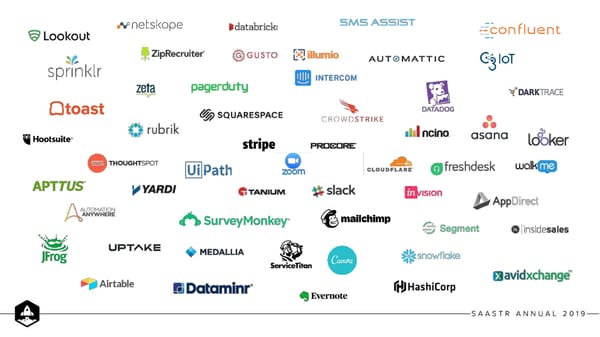
HOW MANY $1B+ PRIVATE CLOUD COMPANIES ARE THERE, TODAY?

This is a modal window.
55

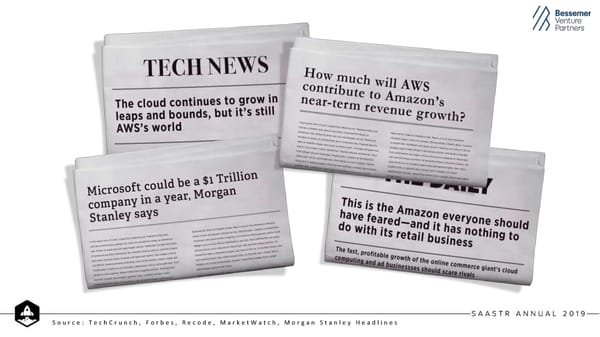
S o u r c e : T e c h C r u n c h , F o r b e s , R e c o d e , M a r k e t W a t c h , M o r g a n S t a n l e y H e a d l i n e s
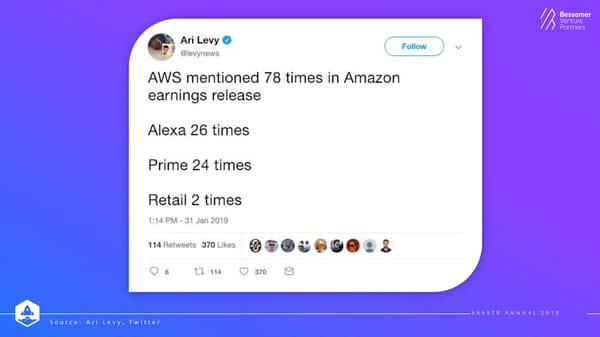
S A A S T R A N N U A L 2 0 1 9 S o u r c e : A r i L e v y , T w i t t e r
S A A S T R A N N U A L 2 0 1 9
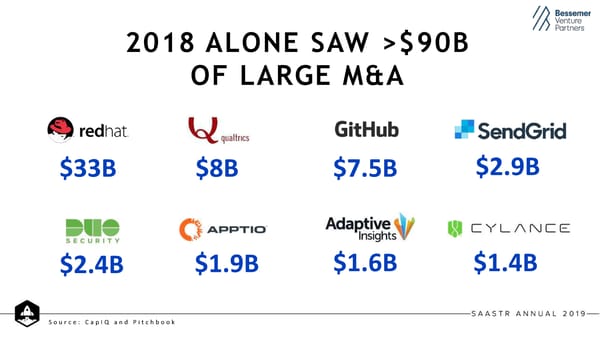
2018 ALONE SAW >$90B OF LARGE M&A $33B $8B $7.5B $2.9B $2.4B $1.9B $1.6B $1.4B S o u r c e : C a p I Q a n d P i t c h b o o k
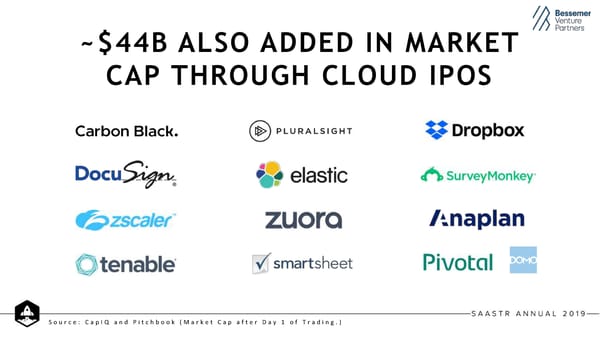
~$44B ALSO ADDED IN MARKET CAP THROUGH CLOUD IPOS S o u r c e : C a p I Q a n d P i t c h b o o k ( M a r k e t C a p a f t e r D a y 1 o f T r a d i n g . )
IN FACT THE BUYING DEMAND FOR CLOUD SHARES HAS HIT RECORD HIGHS Combined Cloud Liquidity 2010 – 2018, and VC Investments Raised $100.00 $45.00 $90.00 $40.00 $80.00 $35.00 $70.00 V B) $30.00 C ($p $60.00 $25.00 Dol Cat $50.00 s Railar ek $20.00 r $40.00 Ma$ $30.00 $15.00 sed ( $20.00 $10.00 $B) $10.00 $5.00 $- $0.00 2010 2011 2012 2013 2014 2015 2016 2017 2018 M&A IPO VC Dollars Raised S A A S T R A N N U A L 2 0 1 9 S o u r c e : C a p I Q a n d P i t c h b o o k

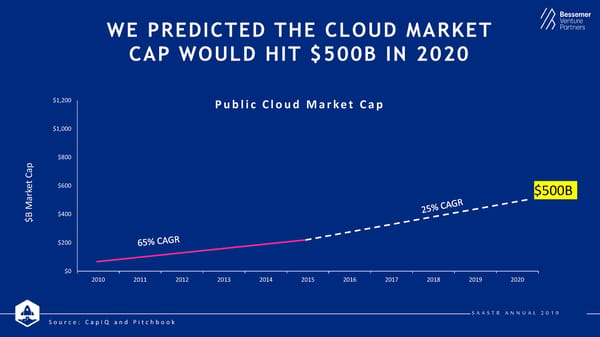
WE PREDICTED THE CLOUD MARKET CAP WOULD HIT $500B IN 2020 $400 $250 Public Cloud Market Cap Capt $200 e Mark$B $0 2010 2011 2012 2013 2014 2015 2016 S A A S T R A N N U A L 2 0 1 9 S o u r c e : C a p I Q a n d P i t c h b o o k
WE PREDICTED THE CLOUD MARKET CAP WOULD HIT $500B IN 2020 $1,200 Public Cloud Market Cap $1,000 $800 Capt e $600 $500B Mark$B $400 $200 $0 2010 2011 2012 2013 2014 2015 2016 2017 2018 2019 2020 S A A S T R A N N U A L 2 0 1 9 S o u r c e : C a p I Q a n d P i t c h b o o k
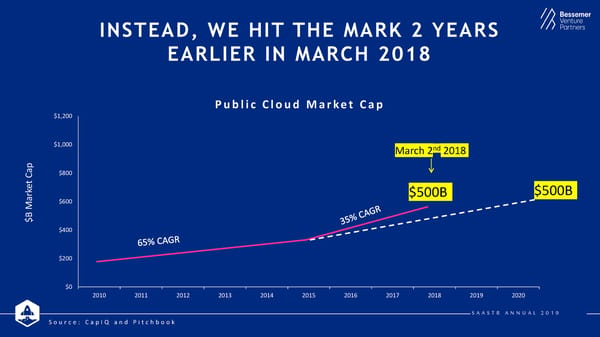
INSTEAD, WE HIT THE MARK 2 YEARS EARLIER IN MARCH 2018 Public Cloud Market Cap $1,200 $1,000 March 2nd2018 Capt $800 e $500B $500B Mark $600 B$ $400 $200 $0 2010 2011 2012 2013 2014 2015 2016 2017 2018 2019 2020 S A A S T R A N N U A L 2 0 1 9 S o u r c e : C a p I Q a n d P i t c h b o o k
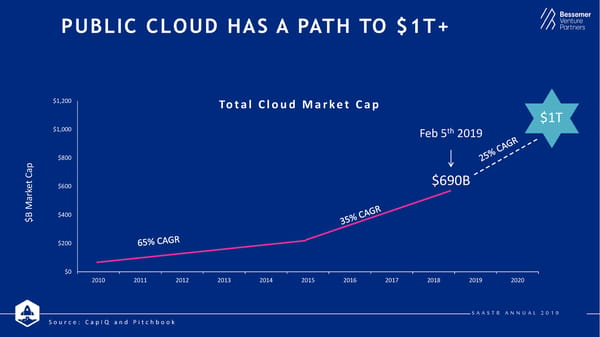
PUBLIC CLOUD HAS A PATH TO $1T+ $1,200 Total Cloud Market Cap $1T $1,000 Feb 5th 2019 $800 Capt $690B e $600 Mark$B $400 $200 $0 2010 2011 2012 2013 2014 2015 2016 2017 2018 2019 2020 S A A S T R A N N U A L 2 0 1 9 S o u r c e : C a p I Q a n d P i t c h b o o k
THE CLOUD 100 IS VALUED AT $175B+ S o u r c e : P i t c h b o o k
HOW DO WE PROTECT FOR BVP Nasdaq Emerging Cloud Index VOLATILITY ? S A A S T R A N N U A L 2 0 1 9
HOW TO BUILD A RESILIENT COMPANY

This is a modal window.
Q: WHEN WAS THE LONGEST BULL MARKET?
2nd Longest Bull Longest Bull Run in Run 9.5 years History ~10 years S o u r c e : y a h o o f i n a n c e . S & P 5 0 0 f r o m 1 9 5 0 t o 1 / 2 9 / 2 0 1 9 .
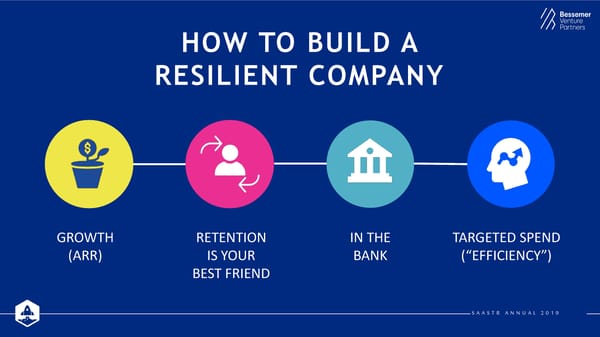
HOW TO BUILD A RESILIENT COMPANY GROWTH RETENTION IN THE TARGETED SPEND (ARR) IS YOUR BANK (“EFFICIENCY”) BEST FRIEND S A A S T R A N N U A L 2 0 1 9
HOW TO BUILD A RESILIENT COMPANY GROWTH (ARR) S A A S T R A N N U A L 2 0 1 9
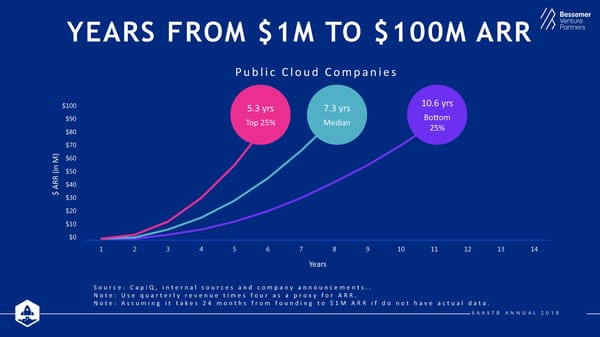
YEARS FROM $1M TO $100M ARR $100 $100 $90 $80 $70 M)in $60 (R $50 AR$ $40 $30 $20 $10 $0 1 2 3 4 5 6 7 8 9 10 11 12 13 14 Years S o u r c e : C a p I Q , i n t e r n a l s o u r c e s a n d c o m p a n y a n n o u n c e m e n t s . Note: Use quarterly revenue times four as a proxy for ARR. Note: Assuming it takes 24 months from founding to $1M ARR if do not have actual data. S A A S T R A N N U A L 2 0 1 9
YEARS FROM $1M TO $100M ARR Public Cloud Companies $100 5.3 yrs 7.3 yrs 10.6 yrs $90 Top 25% Median Bottom $80 25% $70 M)in $60 (R $50 AR$ $40 $30 $20 $10 $0 1 2 3 4 5 6 7 8 9 10 11 12 13 14 Years S o u r c e : C a p I Q , i n t e r n a l s o u r c e s a n d c o m p a n y a n n o u n c e m e n t s . . Note: Use quarterly revenue times four as a proxy for ARR. Note: Assuming it takes 24 months from founding to $1M ARR if do not have actual data. S A A S T R A N N U A L 2 0 1 9
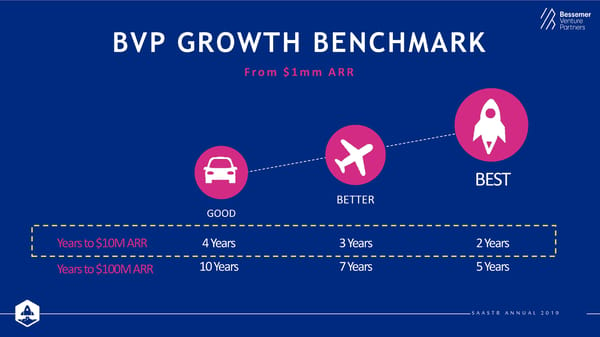
BVP GROWTH BENCHMARK From $1mm ARR BEST BETTER GOOD Years to $10M ARR 4 Years 3 Years 2 Years Years to $100M ARR 10 Years 7 Years 5 Years S A A S T R A N N U A L 2 0 1 9
HOW TO BUILD A RESILIENT COMPANY GROWTH RETENTION (ARR) IS YOUR BEST FRIEND S A A S T R A N N U A L 2 0 1 9
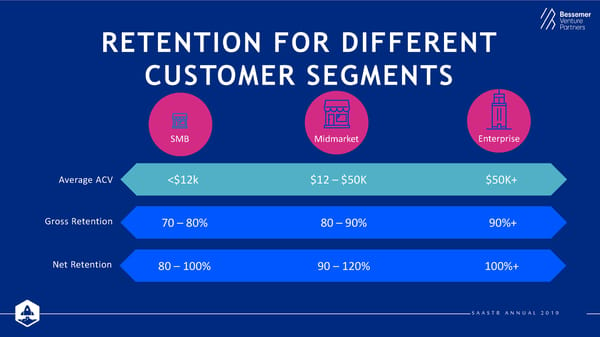
RETENTION FOR DIFFERENT CUSTOMER SEGMENTS SMB Midmarket Enterprise Average ACV <$12k $12 –$50K $50K+ Gross Retention 70 – 80% 80 – 90% 90%+ Net Retention 80 – 100% 90 – 120% 100%+ S A A S T R A N N U A L 2 0 1 9
RETENTION IS A MAJOR DRIVER OF VALUATION $350 100% Net Retention 110% $300 80% $250 Assumed 2019 $200 $200 60% 50% $180 Revenue Mult 10x 42% $150 $150 40% $115 $100 $85 35% $60 30% 20% 20% $50 $40 Enterprise $2.0bn $0 11% 0% Value 2013 2014 2015 2016 2017 2018 2019 S A A S T R A N N U A L 2 0 1 9
AN ADDITIONAL 1% IN NET RETENTION = $100M OF VALUE $350 $347 100% $300 Net Retention 125% $276 80% $250 65% 54% $209 60% $200 Enterprise $150 $148 Value $3.5bn 46% 40% $100 $102 41% 32% $66 20% $50 $40 26% Increased +$1.5bn $0 0% Value 2013 2014 2015 2016 2017 2018 2019 S A A S T R A N N U A L 2 0 1 9
CHURN DRAMATICALLY DECREASES VALUE $350 100% $300 Net Retention 100% 80% $250 $200 60% Enterprise $1.4bn $150 40% $135 $137 Value 34% $120 40% $100 $97 $75 29% $40 $56 20% Decreased $50 24% 13% -$630m $0 0% Value 2013 2014 2015 2016 2017 2018 2019 1% S A A S T R A N N U A L 2 0 1 9
+ S A A S T R A N N U A L 2 0 1 9
HOW TO BUILD A RESILIENT COMPANY GROWTH RETENTION IN THE (ARR) IS YOUR BANK BEST FRIEND S A A S T R A N N U A L 2 0 1 9
S A A S T R A N N U A L 2 0 1 9
QUEEN S A A S T R A N N U A L 2 0 1 9
MANAGE YOUR Buffer for RUNWAY contingency plan 18 – 24 months runway Hiring is a big lever
THINK ONE FINANCING AHEAD ARR Revenue Multiples of Cloud Companies Peak – Mar 2014 12.0x ~10x Current 10.0x 9.8x 8.0x 6.0x 4.0x Trough – Feb 2016 2.0x Trough – May 2014 4.6x 0.0x 5.8x 1/1/1/1/11/1/11/1/12/1/12/1/12/1/13/1/13/1/13/1/14/1/14/1/14/1/15/1/15/1/15/1/16/1/16/1/16/1/17/1/17/1/17/1/18/1/18/1/18/1/19 1 5 9 1 5 9 1 5 9 1 5 9 1 5 9 1 5 9 1 5 9 1 5 9 1 S o u r c e : C a p I Q , i n t e r n a l s o u r c e s a n d c o m p a n y a n n o u n c e m e n t s . P r i c e d a s o f 1 / 2 3 / 2 0 1 9 Note: Use quarterly revenue times four as a proxy for ARR. I n c l u d e s 5 2 p u b l i c c l o u d c o m p a n i e s i n t h e E M C L O U D . S A A S T R A N N U A L 2 0 1 9
HOW TO BUILD A RESILIENT COMPANY GROWTH RETENTION IN THE TARGETED SPEND (ARR) IS YOUR BANK (“EFFICIENCY”) BEST FRIEND S A A S T R A N N U A L 2 0 1 9
DEFINING EFFICIENCY Net New BVP Efficiency = ARR Score Net Burn (<$30M ARR) S A A S T R A N N U A L 2 0 1 9
EFFICIENT BUSINESSES BVP Nasdaq Emerging Cloud Index ARE REWARDED IN ALL MARKETS S A A S T R A N N U A L 2 0 1 9
BVP EFFICIENCY SCORE (<$30M ARR) Net New ARR = GOOD BETTER BEST Net Burn < 0.5x 0.5x – 1.5x > 1.5x S A A S T R A N N U A L 2 0 1 9
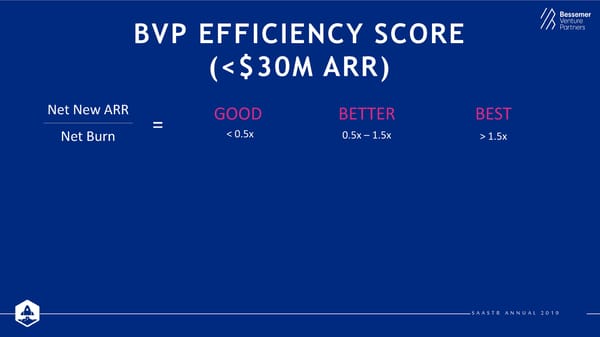
BVP EFFICIENCY SCORE (<$30M ARR) Net New ARR = GOOD BETTER BEST Net Burn < 0.5x 0.5x – 1.5x > 1.5x $24 $12M ($ in M) (= $24 - $12) $12 $2M = 6.0x ($2) BVP Efficiency Score Ending ARR Net Burn S A A S T R A N N U A L 2 0 1 9
FROM GRIT TO GREAT G R I T Growth Retention Targeted GRIT (ARR) + Is Your Best + In The Bank + Spend = SCORE Friend (Efficiency) % YoY Growth % Annual Net Yrsof Runway Net New ARR / Retention Net Burn GOOD 3 –4 50 –200% 80 –150% 1 –3 Yrs 0.5 –1.5x BETTER 4 –6 BEST >6 S A A S T R A N N U A L 2 0 1 9
EXAMPLE 1 – TWILIO (<$5M ARR) G + R + I + T = GRIT SCORE % YoY Growth % Annual Net Yrsof Runway Net New ARR / Retention Net Burn 50 –200% 80 –150% 1 –3 Yrs 0.5 –1.5x 3 + 1.6 + 2 + 1.5 = 8.1 (300%+ Growth) (160% Retention) (2 Years) (1.5x Efficiency) BEST S A A S T R A N N U A L 2 0 1 9
EXAMPLE 1 – SERVICETITAN (<$5M ARR) G + R + I + T = GRIT SCORE % YoY Growth % Annual Net Yrsof Runway Net New ARR / Retention Net Burn 50 –200% 80 –150% 1 –3 Yrs 0.5 –1.5x 2 + 0.9 + 2 + 3.4 = 8.3 (200%+ Growth) (90% Retention) (2 Years) (3.4x Efficiency) BEST S A A S T R A N N U A L 2 0 1 9

2019 PREDICTIONS

This is a modal window.
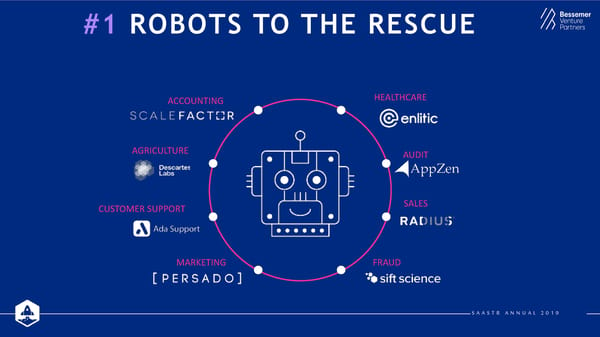
#1 ROBOTS TO THE RESCUE ACCOUNTING HEALTHCARE AGRICULTURE AUDIT CUSTOMER SUPPORT SALES MARKETING FRAUD S A A S T R A N N U A L 2 0 1 9
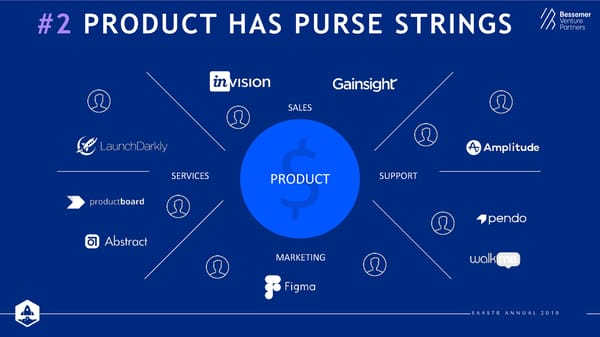
#2 PRODUCT HAS PURSE STRINGS SALES SERVICES PRODUCT SUPPORT $ MARKETING S A A S T R A N N U A L 2 0 1 9
#3 OPENSOURCE MAKES MONEY Biggest IPO Ever Largest M&As Deep Bench of Strong Privates S A A S T R A N N U A L 2 0 1 9
#4 DEEPER VERTICALIZATION OF MOBILE CONSTRUCTION FIELD SERVICES RETAIL SALES ARE SOFTW CAL TI WORKFORCE MGMT EDUCATION SAFETY/COMPLIANCE ERV FLEET TRANSPORTATION REAL ESTATE RECRUITING S A A S T R A N N U A L 2 0 1 9
#5 LOW CODE/NO CODE Developer Easy Business Apps Automation
1 Robots to the rescue 2 Product has purse strings 3 Opensource makes money 4 Deeper verticalization of mobile BESSEMER’S 5 PREDICTIONS 5 Low code/no code FOR 2019
CLOUD REIGNS $1 TRILLION

Thank You www.bvp.com/cloud

