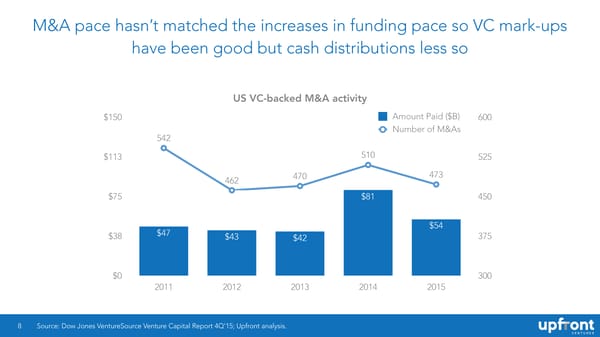
M&A pace hasn’t matched the increases in funding pace so VC mark-ups have been good but cash distributions less so US VC-backed M&A activity $150 Amount Paid ($B) 600 Number of M&As 542542 $113 510510 525 462462 470470 473473 $75 $81 450 $47 $54 $38 $43 $42 375 $0 300 2011 2012 2013 2014 2015 8 Source: Dow Jones VentureSource Venture Capital Report 4Q’15; Upfront analysis.
 Bubble? What Bubble? How It's Different This Time. And How It Most Certainly Isn't Page 7 Page 9